The method
Standards below, gates on the line, the executive view on top.
The same control system, whether the job is a greenfield build or a live estate that cannot go dark.
Two gates, and eleven years of them
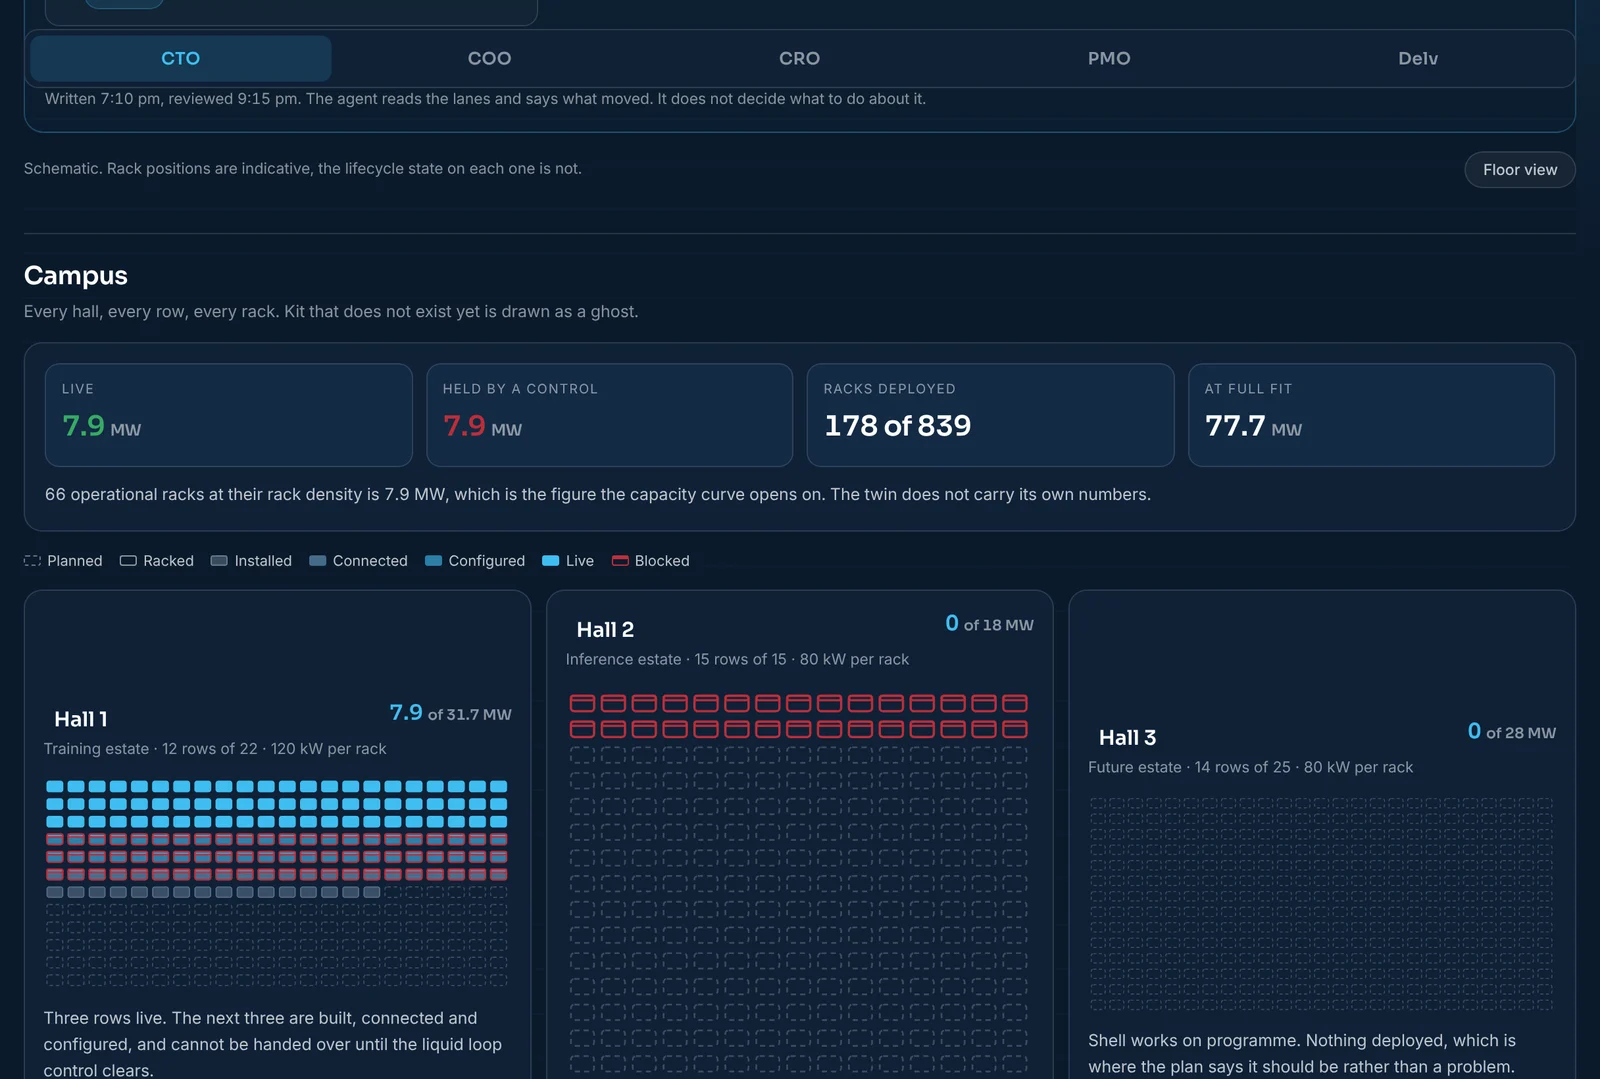
Everything here rests on two checkpoints. C1 governs the architecture before the work starts, so a design is tested before design effort is funded. C2 governs what is allowed to reach production, so nothing arrives in an operational environment without having cleared it. These two are the ones that stop the line. The fuller set they sit in is below, under assurance and control.
These are not a framework borrowed for a slide. They appear under the same two names in three independent places across eleven years. As Compliance and Certification on the eHealth NSW network standards from 2015, which is public and set out on the projects page. As architecture control and deployment control in the Platform Control Centre. And as running software in The Build, where a subsystem sits held out of operational by an uncleared C2.
A gate that survives eleven years and three contexts is a method. A gate invented for a proposal is a diagram.
The control centre below was developed for and presented into a multi-site retail and hospitality group, through a prime contractor. That engagement did not go on to run, so it is offered here as a method with a history rather than as a case study with an outcome.
The Platform Control Centre
Drawn from the whiteboard it started on, rather than pressed into the shape of the logo.
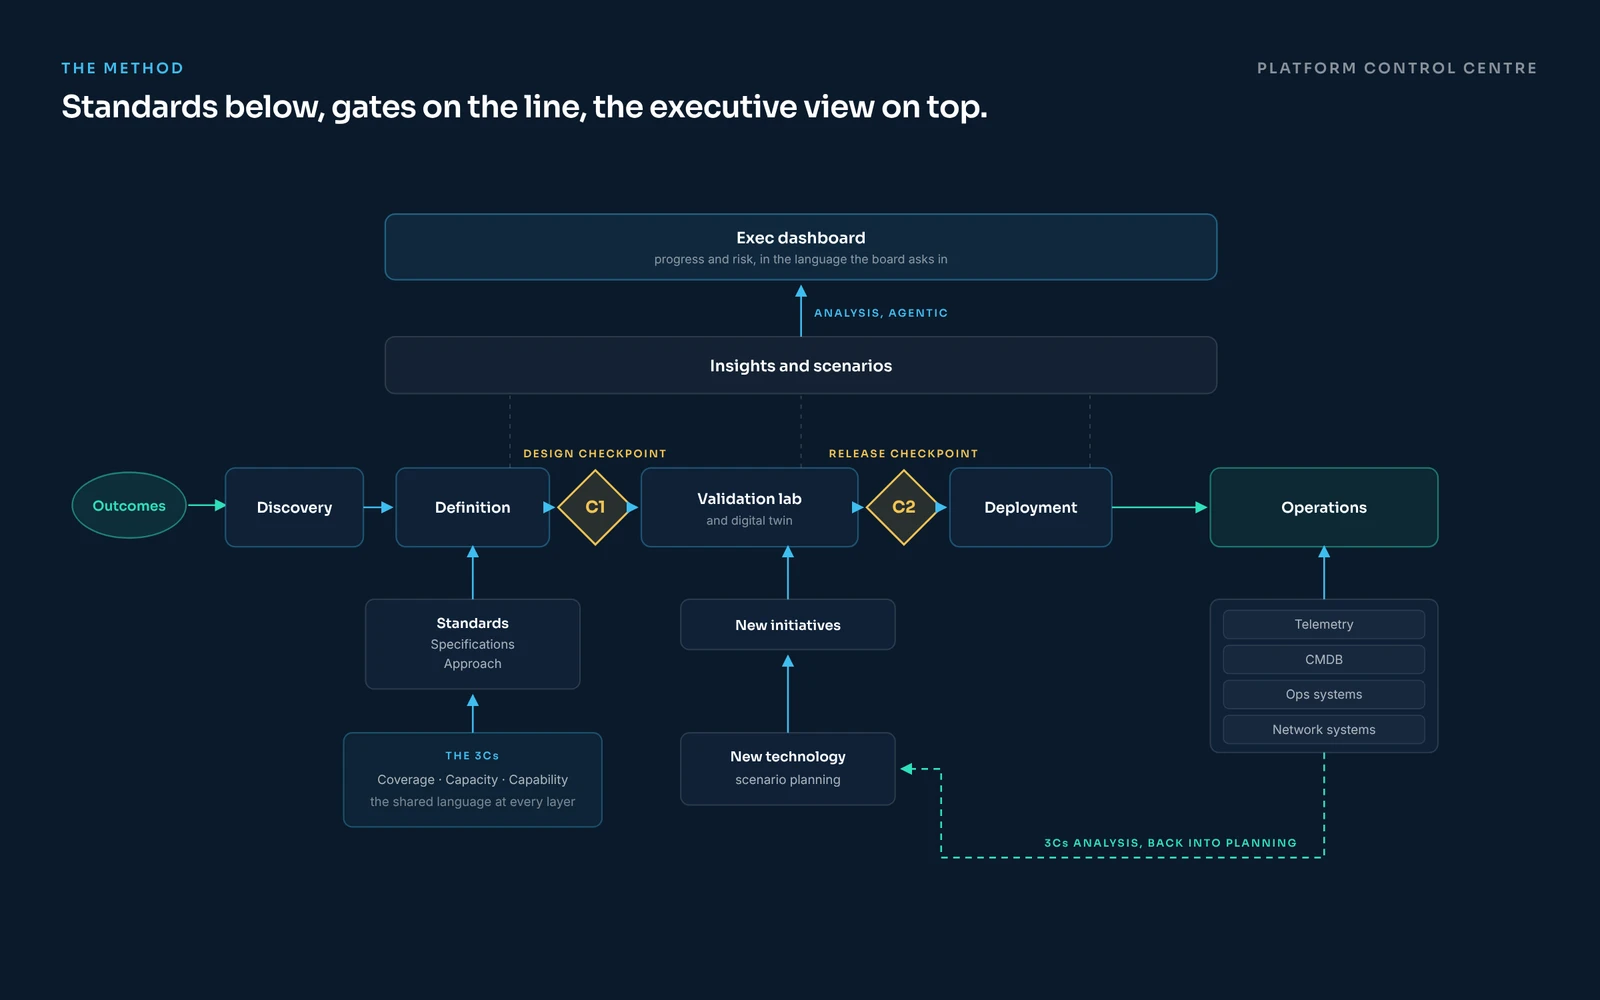
Outcomes drive the line. Standards, specifications and approach feed it from below. New technology meets a validation lab and a digital twin before it meets a running site. Telemetry, the CMDB and the operational systems feed back up through scenario planning, and an agentic layer turns all of it into a view a board can act on.
An earlier version of this drawing put the method on a figure-8, because the brand mark is a loop and the method is continuous. That was pattern matching. Continuity is one property of the method, and drawing only that threw away the layering, the gates as sequential checkpoints, the feeds from below and the executive surface on top. This one is the whiteboard.
Coverage, Capacity, Capability
Connecting systems is half the answer. The other half is that no two of them measure the same way, so even collected by hand their numbers do not compare.
The 3Cs are the normalising language, applied at every layer of the platform and at every stage of the lifecycle. Coverage asks whether the platform exists everywhere the business needs it. Capacity asks whether it can carry the workload, and where the headroom runs out. Capability asks whether it can do the thing required, and what cannot yet be evidenced to a regulator.
Three questions, asked the same way at every level, which is what lets one picture answer a CTO, a COO and a chief risk officer without three separate reports.
The same machine at two scales
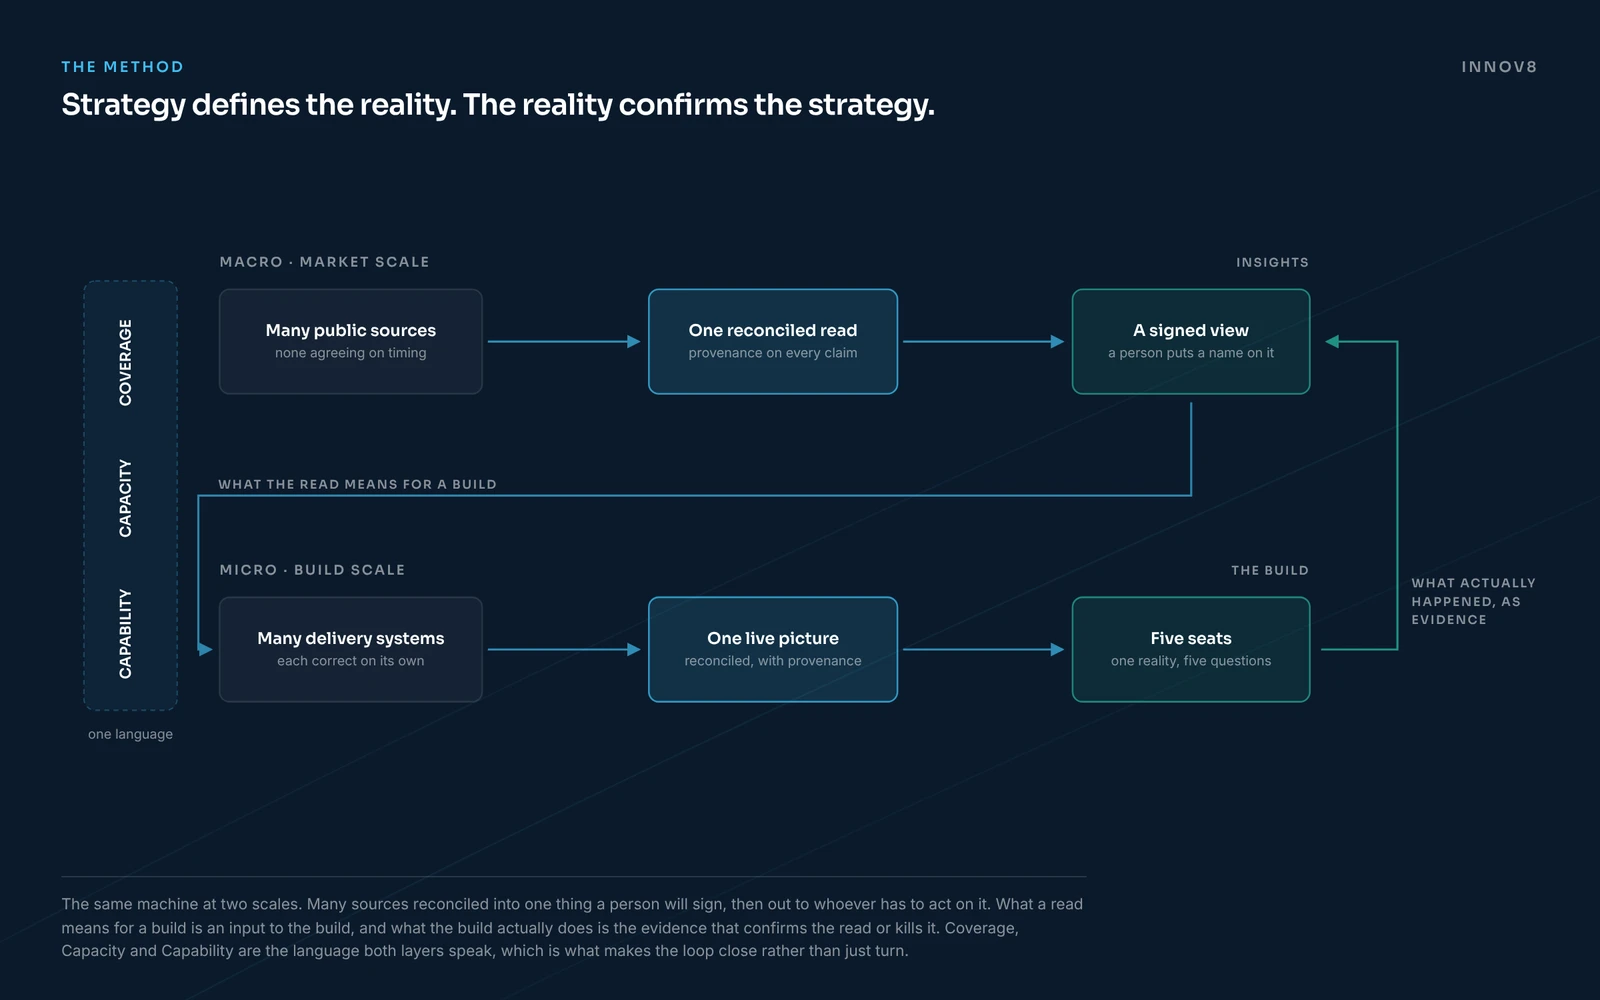
What a read means for a build is an input to the build. What the build actually does is the evidence that confirms the read or kills it.
The build engine
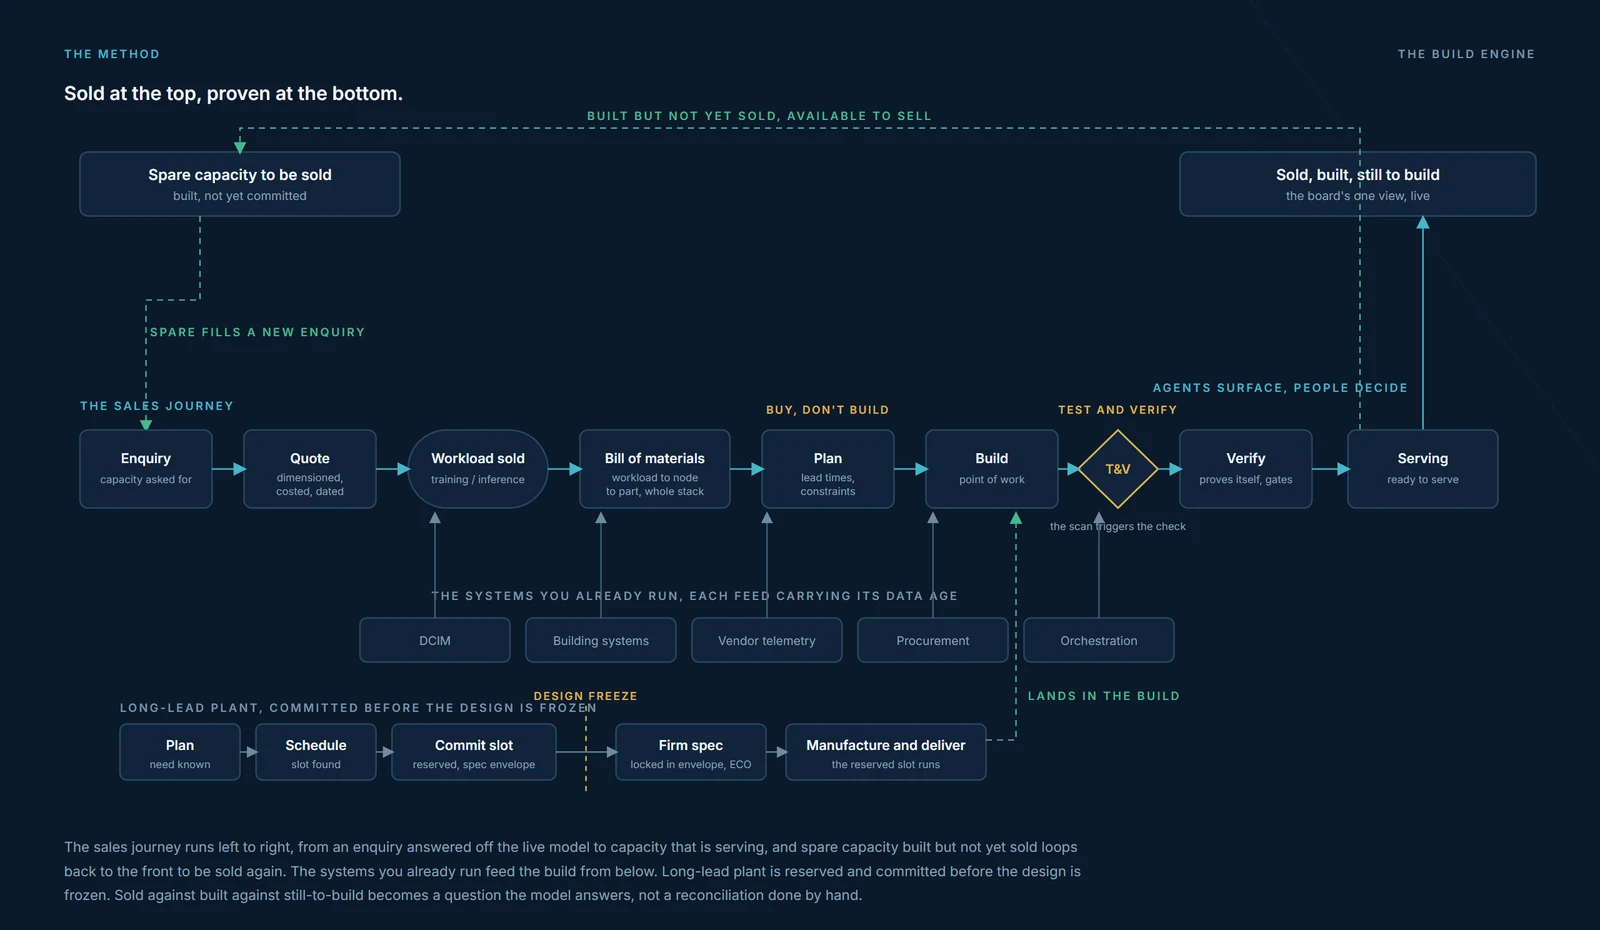
At build scale the method takes a manufacturing shape. Capacity is treated as a product that is manufactured: the workload a customer buys sits at the top of one bill that runs the whole stack, an engine plans it, the systems already in place feed it, long-lead plant is committed before the design is frozen, and the physical work proves itself through the same two gates. Spare capacity that is built but not yet sold loops back to be sold, and sold reconciles to delivered off the one spine.
Assurance and control
Every gate is a pair: a machine step that prepares the decision, and a human step that makes it. The machine never makes the call, and the person never makes it without the evidence.
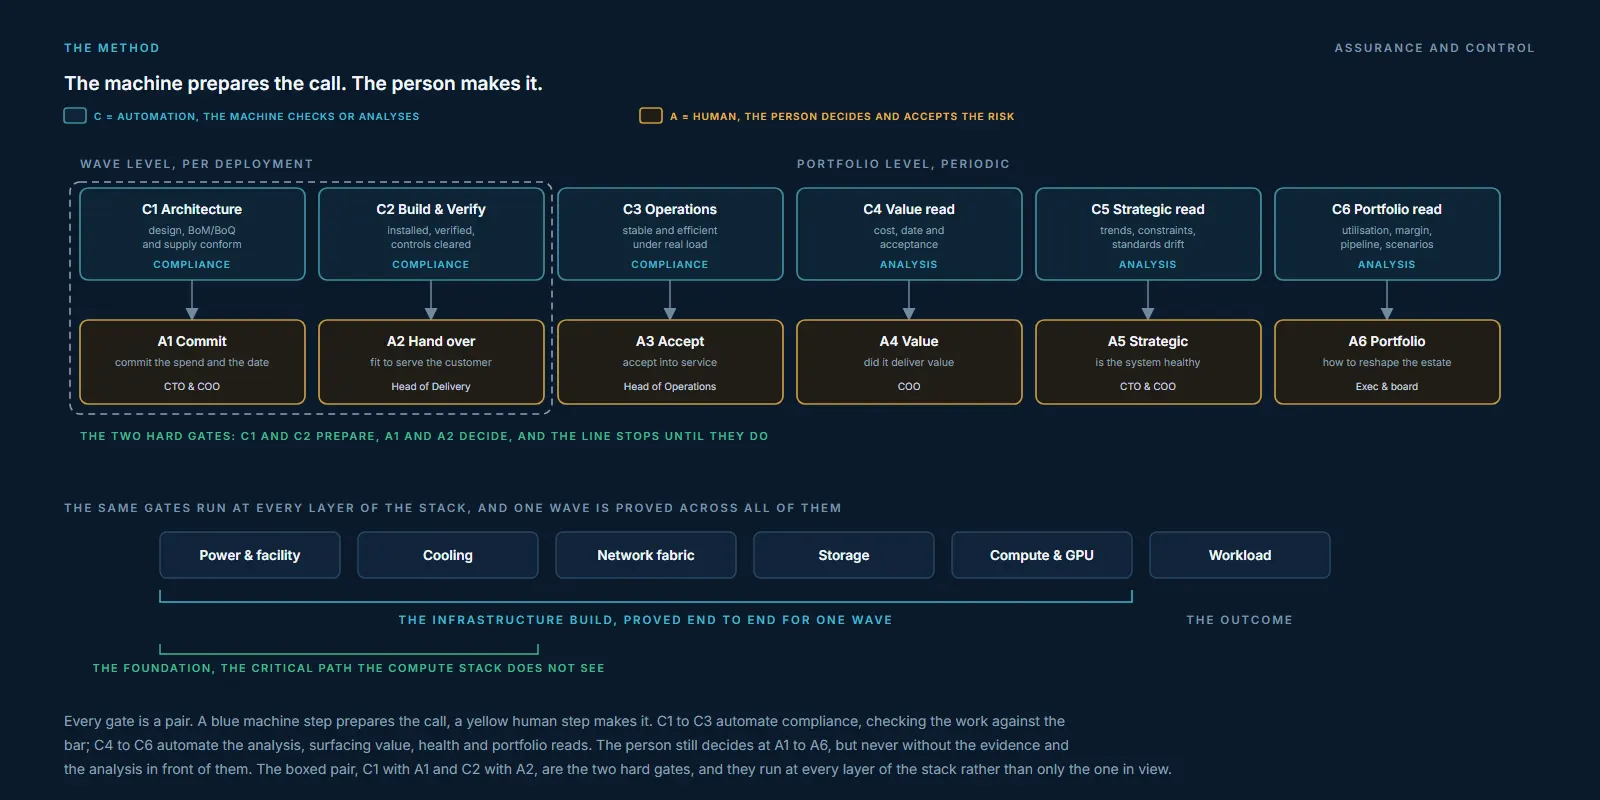
Six machine steps prepare six human decisions. Compliance and analysis on one side, the calls that accept the risk on the other.
The machine steps, C1 to C6, are all automated. C1 to C3 check compliance, the design against the standards, the build against the verify criteria, the operation against the telemetry. C4 to C6 run the analysis, surfacing the value, the health and the portfolio reads a person needs. The human steps, A1 to A6, are the decisions: commit, hand over, accept, then value, strategic and portfolio. Two of those, the commit and the hand-over, are the hard gates that stop the line; the rest keep the picture honest as the estate grows.
So the boundary is not that some gates run themselves and others are human. Every gate is instrumented. The human decisions are the well-informed few, never guesses. That is what lets the same structure run the build and settle an outcomes-based contract, because an outcome you can measure and evidence is one you can contract on.
Agents propose. People decide.
Agents watch, reconcile and surface. People decide, design and own. Agents invent nothing, and every derived record carries a marker saying which source produced it and when, so a figure can always be walked back to the thing it came from.
That is the difference between generic AI providing signals and a system providing decisions that are accountable and auditable. It is also why the gates matter. An agent can propose that a control is clear. Only a person clears it.